
On the first of September, I celebrated my first anniversary of starting work at the University of Exeter. It’s been a great year, and I’ve learned a lot – but I was also interested to see how I’d spent my time this year.
Some of you might know that I track how I spend my working hours. I blame my friends who introduced me to the idea of billable hours – though I was slightly horrified that one of them had to account for her time in 10ths of an hour, i.e. chunks of 6 minutes. A few years ago I started tracking my time in (much more reasonable!) half-hour chunks. It’s important to say that this has always been a no-judgement exercise. I’m not trying to get myself to work more, or to spend my time in a particular way, it’s just for record keeping. Because I like data, I suppose.
The contract I am on requires 1600 hours a year – or, to put it a more normal way, an average of 36.5 hours per week with 41 days of annual leave. There are obvious peaks and troughs in the academic year, with marking periods being much busier than summer research periods, for example, which is why it’s expressed in hours per year. That works pretty well for me – I can do a lot more hours of marking in a week than I can do research which, for me at least, needs a lot of downtime for mulling things over.
Counting up the hours for the year, I can now see that I came in at around the 1600 hours mark (actually, just a couple of hours under). This is kind of amazing to me, as of course I couldn’t possibly have planned for my yearly hours to add up, but there you go.
So how did I spend those hours?
My work tracking charts are just Excel spreadsheets with colours corresponding to different activities. There are a lot of different activities on there, but for the purposes of adding up the hours for the year, I divided them into “Research”, “Teaching” and “Other”.
Research includes
- planning
- reading
- learning (e.g. a new skill or language I need for my current research)
- data collection
- data analysis
- writing
- editing
- conferences and seminars that are relevant to my research, whether I’m presenting or attending
Teaching includes
- lecturing
- seminars
- supervision time for undergraduate and postgraduate dissertations
- reading student work
- marking
- teaching preparation
- personal tutoring
Other includes
- answering emails
- administration
- meetings
- updating blogs and social media (whether my own or one of the others I’m responsible for)
- departmental events, such as graduation or away days
- departmental seminars that are not related to my research
- events and meetings related to other organisations, such as the WCC
- university training, including PCAP
- travel time to conferences or other off-site events (but not my regular journey to work)
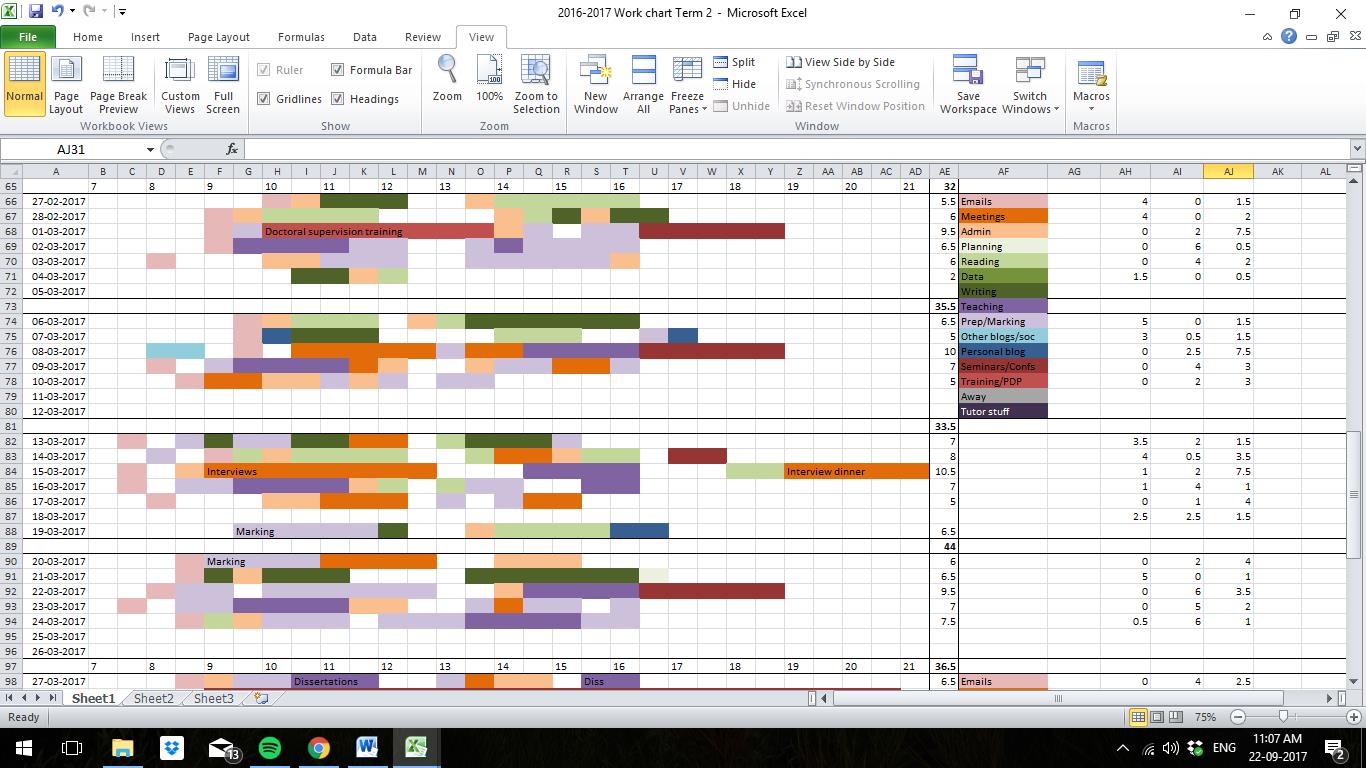
[Edited to add a picture of what the chart looks like:]
Over my first year as a Lecturer, I spent 27% of my time on Research, 36% on Teaching and 37% on Other activities.
If we break it down by term, you can see that this wasn’t evenly spread over the year, mostly because my teaching was heaviest in Term 1. I also did fewer overall hours in the summer, even in weeks when I was at work, because I find that my research benefits from fewer better-quality hours.
- Term 1: Research 9%, Teaching 58%, Other 33%
- Term 2: Research 34%, Teaching 30%, Other 36%
- Term 3: Research 42%, Teaching 7%, Other 51%
- Summer: Research 45%, Teaching 19%, Other 36%
Overall, I’m pretty pleased with that. I didn’t think I would manage to get much research done in the first term of my new job, which was absolutely true – but Term 3 and the summer gave me time for that part of my work. I did a lot of writing between May and July, in particular, and met all my research goals for this year. So although 27% might not look like a lot of time for research, I know that it was good-quality time, and that I achieved a lot with it.I also did some big one-off projects, such as passing PCAP, so it’s possible that I might be able to carve out some extra research time next year.
Happy September, everyone!


Hi Andrea, I’ve edited the post above with a picture.
LikeLike
Hi, I was wondering if you could post a picture example of your Excel sheet? I’m not entirely sure what that would look like. Thanks!
LikeLike